Jump to section:
Quadratics
Graph in Desmos. You can also use vertex form, symmetry, or the vertex formula.
Show Answer
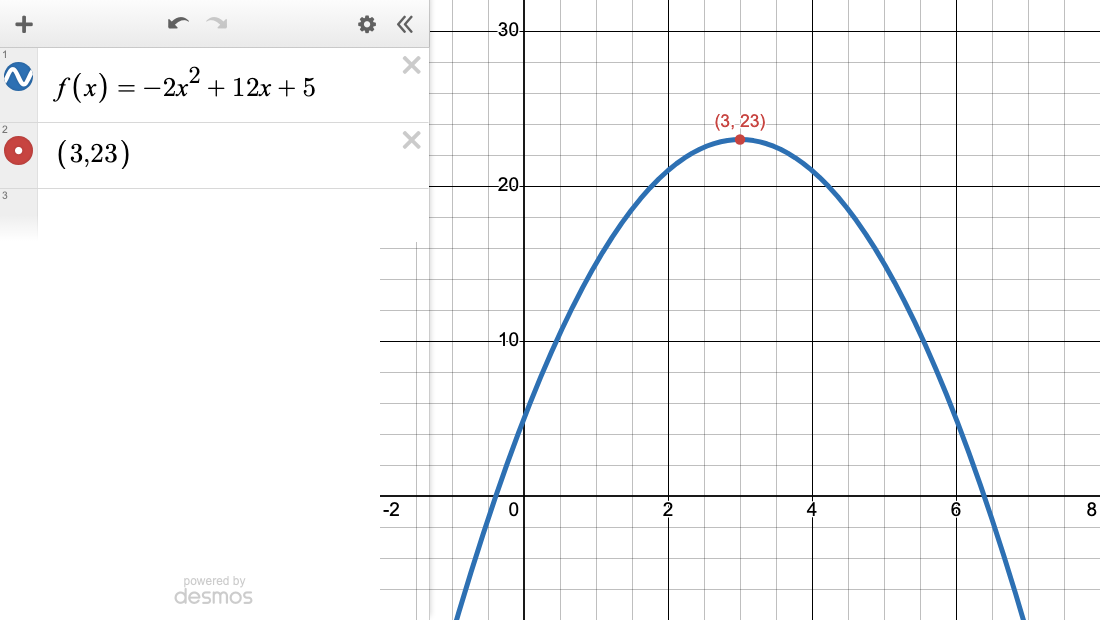
In Desmos, graph f(x) = −2x² + 12x + 5.
The parabola opens down because a = −2, so the vertex is a maximum.
The x-value of the vertex is
x = −b2a.
a = −2 and b = 12.
x = −122(−2).
x = −12−4.
x = 3.
f(3) = −2(3²) + 12(3) + 5.
f(3) = −18 + 36 + 5.
f(3) = 23.
Answer: 23
Show Answer
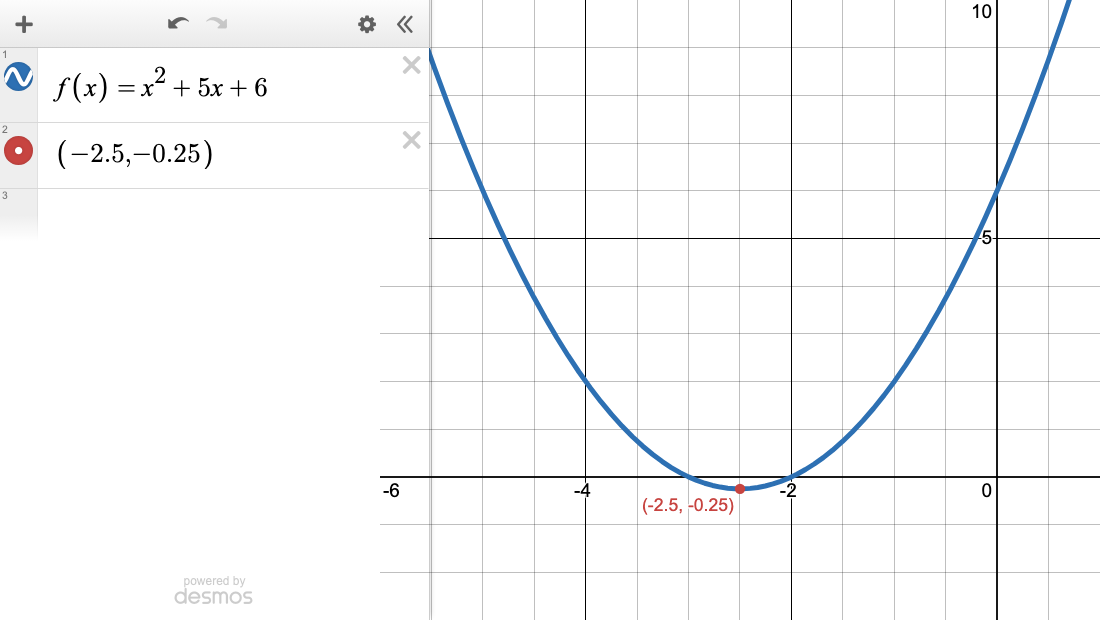
f(x) − 6 = x² + 5x.
Add 6 to both sides.
f(x) = x² + 5x + 6.
In Desmos, graph f(x). The parabola opens up, so the lowest point is a minimum.
The x-value of the vertex is
x = −b2a.
a = 1 and b = 5.
x = −52 · 1.
x = −52.
Desmos shows that same x-value as −2.5.
Answer: −52
Show Answer
Vertex form is g(x) = a(x − h)² + k.
The vertex is (h, k).
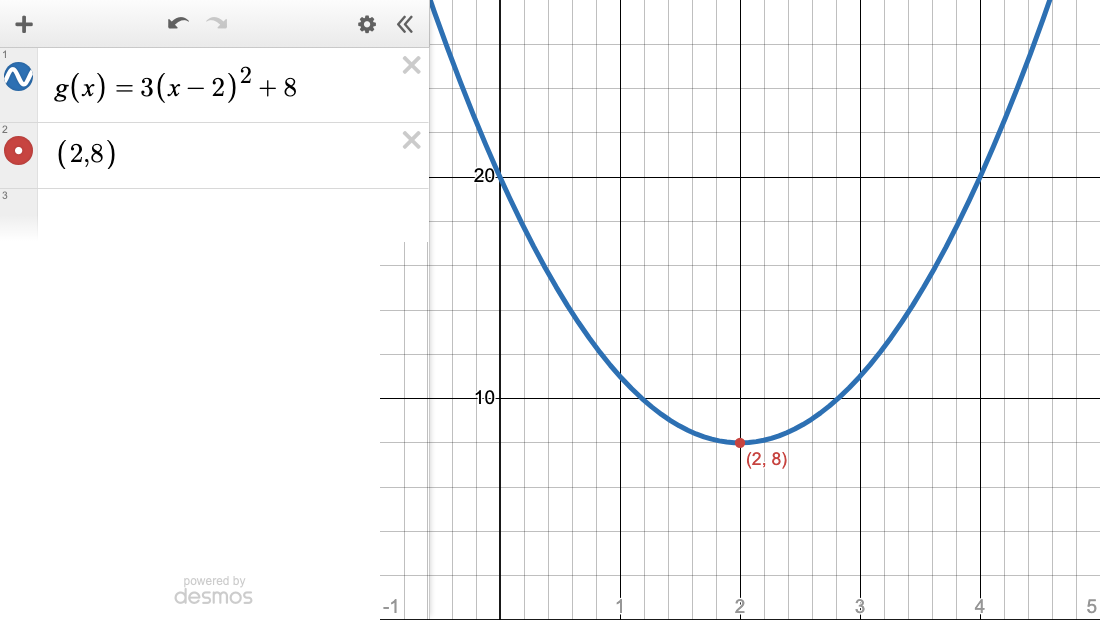
g(x) = 3(x − 2)² + 8.
h = 2 and k = 8.
In Desmos, the turning point of the graph is (2, 8).
Answer: (2, 8)
Show Answer
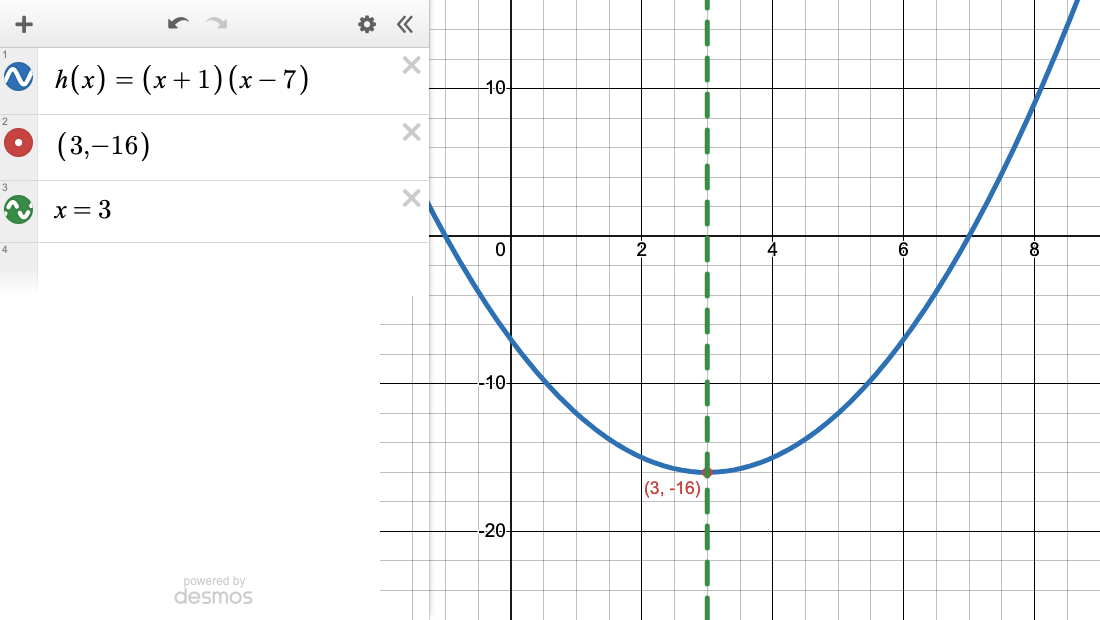
h(x) = (x + 1)(x − 7).
The x-intercepts are x = −1 and x = 7.
The axis of symmetry is halfway between the intercepts.
x = −1 + 72.
x = 62.
x = 3.
In Desmos, that is the vertical line through the vertex.
Answer: x = 3
Show Answer
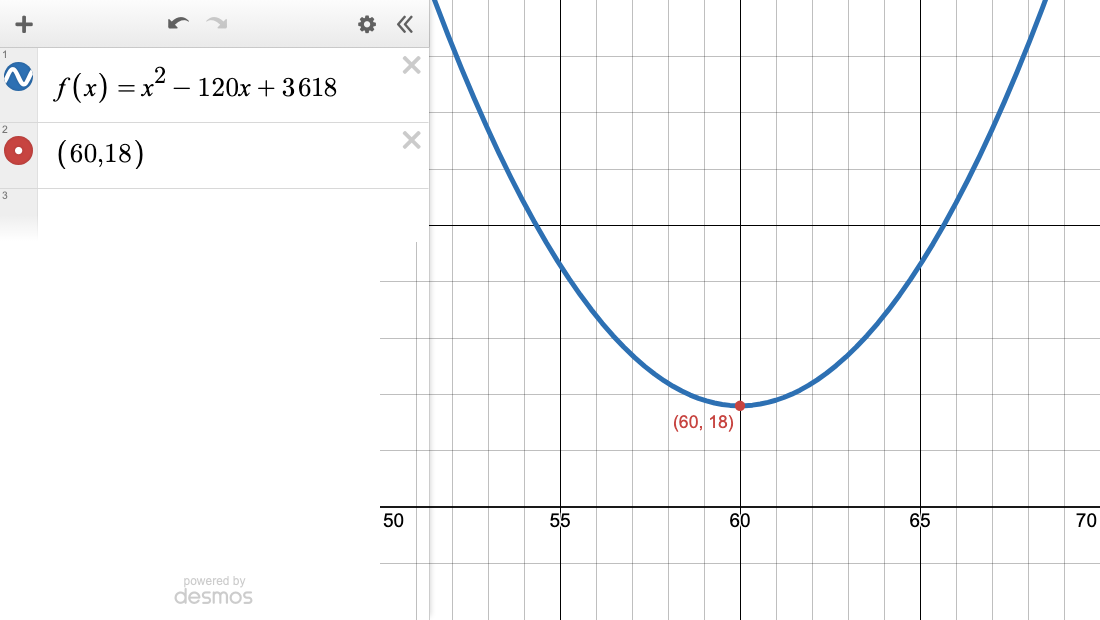
f(x) = x² − 120x + 3618.
The y-intercept is 3618. The minimum is the y-value of the vertex.
In Desmos, graph f(x) and zoom until the lowest point is on the screen.
The x-value of the vertex is
x = −b2a.
a = 1 and b = −120.
x = −(−120)2 · 1.
x = 1202.
x = 60.
f(60) = 60² − 120(60) + 3618.
f(60) = 3600 − 7200 + 3618.
f(60) = 18.
Answer: 18
Show Answer
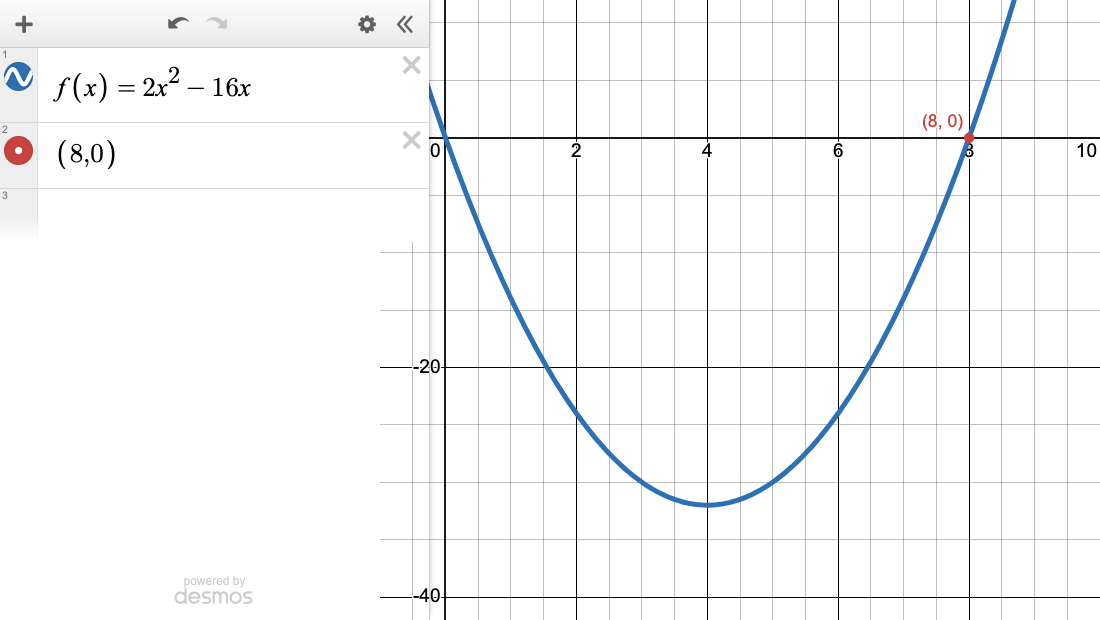
f(x) = 2x² − 16x.
Factor.
f(x) = 2x(x − 8).
The x-intercepts are the solutions of f(x) = 0.
2x = 0 or x − 8 = 0.
x = 0 or x = 8.
The intercepts are (0, 0) and (8, 0).
In Desmos, the graph crosses the x-axis at 0 and at 8.
Answer: 8